


- The Most Common Natural Disasters In Australia - 26/04/2023
- Soft Tissue Injuries – What Are They & How Can You Best Recover? - 26/04/2023
- 8 Dangerous Myths About First Aid - 24/04/2023
Australia has a reputation in popular media. In many countries, popular media represents us as a vast wild wilderness full of snakes, spiders, and shark-infested coastlines. The general perception is that our nation is one of the more dangerous places on earth and that living in Australia is not for the faint of heart.
In many ways, Australians lean into this perception – loving our rugged, fearless persona. But does the reality match up with the story? What are the numbers behind living in Australia? Do Australians live cheerful but short lives before the snakes get us, or is living in Australia more comfortable than many people realise?
Is our population growing? Do we really have an “Aging” population, and what does that mean? Is the picture different for men and women, or are certain regions better to live in than others? How are Australians on multiculturalism, or religion? And how does Covid 19 factor into it all?
Let’s take a moment to look at the real story behind living in Australia, and just what the numbers really show.
The Bad News
So what are some of the risks that come with living in Australia? Is down-under really the snake and spider-infested death trap that the media makes it out to be? Let’s start with some of the best-known hazards of Australia – Snakes, Spiders, Sharks, and other deadly beasts.
How Many People Die From Deadly Animals In Australia?
Australia has a global reputation for being filled with venomous and deadly wildlife, and popular myth suggests surviving to adulthood in Australia is something of a miracle. However, the reputation is probably not deserved. While we certainly do have some deadly creatures – including the world’s most venomous snake and spider and the deadly great white shark – the actual fatalities caused by wildlife are relatively low.
For example, while it’s true that Australia gets more fatal shark attacks than any other country (60% of the global total over the last 60 years) that’s not actually a very large number. In fact, from 2001 to 2017, Australia had only 27 fatal shark bites – an average of around 1½ every year. Statistically, kangaroos cause more deaths than that.
Likewise, although we have the world’s most venomous snake (the inland taipan), it’s actually never killed a human – it’s a shy creature that lives away from most major cities (hence the name). And although the Eastern Brown has a more fearsome reputation (accounting for around half the snake deaths in Australia), as a nation, we generally only see around 1-2 snake-bite deaths each year.
Spider deaths are even rarer. Although we have the world’s most venomous spider (the Sydney Funnel Web) and the famous redback spider, in the last 40 years Australia has only had one spider bite-related death. This is largely due to the development of effective antivenoms in recent decades – meaning even serious bite victims that receive good first aid and medical care will recover.
Australia actually only sees around 32 animal-related deaths a year – with horses accounting for almost a third of those.
| Animal | Deaths (2001-2017) |
| Horses | 172 |
| Bovine (Cows, bulls and other bovine animals) |
82 |
| Dogs | 53 |
| Kangaroos | 37 |
| Snakes | 37 |
| Bees | 31 |
| Sharks | 27 |
| Crocodiles | 21 |
| Total | 541 |
SOURCE: https://www.ncis.org.au/wp-content/uploads/2020/03/NCIS-fact-sheet-Animal-related-deaths.pdf
Do Many Australians Die From Natural Disasters?
Although they’re not exactly a regular occurrence, Australia is prone to some large-scale natural disasters – and on average, they cause a lot more deaths than snakes. These have also begun to be more frequent in recent years.
Although it might seem like almost a cliché, the deadliest type of natural disaster in Australia is the heat. Heatwaves have killed an official total of 4,555 people in Australia since 1900 and account for some of the deadliest natural disasters we have on record – including the heatwave that triggered the Black Friday bushfires of 1939, and the 1895-1896 heatwave in Bourke NSW that left 437 people dead. Yes, overheating can very easily kill you without proper medical attention.
Australia’s average temperature has also been gradually increasing over the last century – by around 1.4°C, which is pretty significant, statistically speaking. The Australian Bureau of Meteorology has also said that further warming is now inevitable, meaning heatwaves will probably occur more often and with increasing intensity in coming years. 2019 was the hottest year on record.
Floods take the number two spot, with a total of 1,911 deaths since 1900. Floods happen on an epic scale in Australia, with the Queensland floods of early 2011 affecting an area the size of Germany. This is followed by tropical cyclones, which caused 1,216 deaths (not including Cyclone Mahina in 1899, which was the deadliest cyclone in Australian history with a death toll of 410).
Bushfires then come in at fourth place, with 974 deaths. The 2019-2020 bushfires alone caused 34 direct deaths and an estimated 445 more due to secondary factors like smoke inhalation. The Royal Commission into National Natural Disaster Arrangements has predicted that such fires are only going to get worse.
Of course, Australia is far from the most dangerous place to live for natural disasters – we’re actually reasonably low on the scale, with only 0.02 deaths per 100,000 people in 2019. For reference, the US weighed in at 0.03 deaths per 100,000, India at 0.15, Indonesia at 0.24, and Mozambique at a whopping 2.21.
There are many reasons for this, but one of the big ones is that major Earthquakes – which kill more people globally than all other disasters put together – are relatively rare here, and Tsunamis (the deadliest subtype of earthquake) are almost unheard-of.
What’s The Death Rate In Australia?
In 2021 – the last census year – there was an official reported total of 171,469 deaths. This meant an overall standardised death rate of 5.1 deaths per 1000 people (this is different from the crude death rate, which doesn’t adjust for age). The figure was different for men and women, with men suffering a reported 6 deaths per 1000 people and women suffering only 4.3 – women have had a lower death rate throughout much of Australia’s history.
Looking purely at the numbers, the number of Australian deaths in a given year has progressively increased, but this is just because our population is steadily increasing – more people means more deaths, plain and simple. If we instead look at the standardised death rates, the figures are a lot more promising – our death rate has been steadily declining for at least four decades.
In 1981, the death rate for women was a substantial 7.7 deaths per 1000 people. It was almost twice that for men – 13.2 deaths per 1000 people. The eighties were clearly a dangerous time for Australian males. Fortunately, since then the rates have not only been dropping, but drawing closer together. Although there have been spikes along the way (such as in 2019, where the rate jumped up a little), it’s hard to argue that life expectancy in Australia is getting progressively better.
In fact, according to the United Nations in 2022, Australia currently has the third highest life expectancy in the world, beaten only by Monaco (recently declared by Forbes as the world’s most expensive place to buy property) and Japan, which consistently places highly in global life expectancy rankings. Our female life expectancy is fifth highest in the world (Korea and Malta just sneak past us in those rankings), and we actually have the 2nd highest male life expectancy of anywhere in the world – even more so than Japan (home of the certified oldest man in recorded history). To put it another way, Australia has the highest male life expectancy of anywhere you could actually afford to live.
So it seems that despite our reputation for having some of the world’s most venomous spiders and snakes, living in Australia may actually help your life expectancy!
Top 10 Countries for Global Life Expectancy
| Country | Age (Years) |
| Monaco | 86.54 |
| Japan | 84.69 |
| Australia | 84.32 |
| Republic of Korea | 83.61 |
| Malta | 83.36 |
| Norway | 83.2 |
| Switzerland | 83.07 |
| Singapore | 82.86 |
| Liechtenstein | 82.8 |
| New Zealand | 82.74 |
Top 10 Countries for Male Life Expectancy
| Country | Age (Years) |
| Monaco | 84.78 |
| Australia | 82.89 |
| Japan | 81.61 |
| Norway | 81.47 |
| Iceland | 81.1 |
| Switzerland | 81 |
| New Zealand | 80.88 |
| Ireland | 80.81 |
| Malta | 80.61 |
| Sweden | 80.6 |
Top 10 Countries for Female Life Expectancy
| Country | Age (Years) |
| Monaco | 88.44 |
| Japan | 87.72 |
| Republic of Korea | 86.7 |
| Malta | 86.22 |
| Australia | 85.72 |
| Singapore | 85.32 |
| France | 85.17 |
| Switzerland | 85.08 |
| Spain | 85.01 |
| Liechtenstein | 85.01 |
SOURCE: https://www.abs.gov.au/statistics/people/population/life-tables/2019-2021
For reference, the official title of “oldest person in Australia” is held by Christina Cock, a Victorian woman who passed away in 2002, at the age of 114.
What Are The Leading Causes Of Death In Australia?
So with such good life expectancy rates, what medical conditions cause the largest number of deaths in Australia? The top five for many years have been as follows:
- Ischaemic heart disease – A blockage of the arteries that supply blood to your heart. Also called Coronary heart disease. The leading cause of death in Australia, and a major cause of stroke and cardiac arrest.
- Dementia, including Alzheimer’s disease – A slow degradation of someone’s memory, intellect, and ability for rational thought. It most commonly affects people 65 years and older.
- Cerebrovascular Diseases – A variety of medical conditions that affect the blood vessels and circulation within the brain, potentially causing strokes.
- Malignant neoplasm of trachea, bronchus and lung – More broadly known as lung cancer. Often caused by smoking.
- Chronic lower respiratory diseases – A group of common respiratory diseases, including asthma and emphysema.
All of Australia’s top five causes of death are non-communicable diseases – meaning they cannot be transferred from one person to another.
Australia’s mercifully low Covid 19 fatality rates have meant that Covid itself ranks quite low among causes of death – only the 34th leading cause of death in Australia, with a total of 1,122 deaths in 2021.
By contrast, 2022 had the lowest number of flu deaths on record, with only 2 deaths – down from 55 in 2020, and 1,076 in 2019. That’s more than a 99.8% reduction in flu fatalities in two years. It seems that social distancing and lockdowns for Covid have also been surprisingly effective in controlling the spread of other infectious diseases as well.
Australian Deaths From Preventable Causes
In 2021, 26,967 deaths were identified as being from potentially preventable causes – that’s around 15% of the total deaths in Australia. This figure includes long-term conditions such as cancer and diabetes, sudden onset medical emergencies such as heart attack and stroke, and external causes such as suicide or aggravated assault. This figure is the lowest it’s been in 10 years, although only by a narrow margin – only 28 people less than the previous year.
A significant majority of preventable deaths are men – 17,113 men versus only 9,854 women, or a ratio of roughly nine men for every five women. Although the overall mortality rate has decreased over recent years, this ratio of men to women has not changed.
How Could Preventable Deaths Be Reduced?
There are a wide range of causes for preventable deaths, meaning there’s no single strategy to lessen preventable deaths across the board. But many factors could improve the situation. For example, deaths due to suicide (which account for more than 11% of preventable deaths) and related to drug and alcohol abuse could potentially be reduced with better access to (or use of) support services such as Lifeline and the Suicide Call Back Service.
For reference, in Australia there is a wide range of support services that are available online or by phone at all times – 24 hours a day, 7 days a week. These services are free, and available to anyone in need of support.
| Organisation | About | Phone |
|---|---|---|
| Lifeline | Provides access to crisis support and suicide prevention services. | 13 11 14 |
| Suicide Call Back Service | Provides immediate telephone counselling and support in a crisis. | 1300 659 467 |
| Beyond Blue | Supporting people affected by anxiety, depression and suicide. | 1300 224 636 |
| MensLine Australia | Telephone and online support, information and referral service for men with concerns about family and relationships, mental health, anger management, family violence (using and experiencing), substance abuse and wellbeing. The service is available from anywhere in Australia and is staffed by professional counsellors, experienced in men's issues. | 1300 789 978 |
| Kids Helpline | Telephone and online counselling service for young people aged 5 to 25. | 1800 551 800 |
| ReachOut | Online mental health service for under-25s and their parents. | na |
| National Alcohol and Other Drugs Hotline | Hotline for anyone affected by alcohol or other drugs. Support includes counselling, advice and referral to local services. | 1800 250 015 |
| Family Drug Support | Help for individuals and families dealing with drug and alcohol use. Also provide support groups, education programs, counselling and bereavement services for families. | 1300 368 186 |
| 1800RESPECT | National domestic, family and sexual violence counselling, information and support service. | 1800 737 732 |
| 13YARN | Aboriginal & Torres Strait Islander crisis support line for people feeling overwhelmed or having difficulty coping. | 13 92 76 |
| StandBy - Support After Suicide | Australia's leading suicide postvention program dedicated to assisting people and communities bereaved or impacted by suicide, including individuals, families, friends, witnesses, first responders and service providers. | 1300 727 247 |
SOURCE: https://www.abs.gov.au/statistics/health/causes-death/causes-death-australia/2021#crisis-support-services
Another factor that could potentially impact these numbers is a better understanding among Australians of the principles of mental health first aid. Although the idea of helping someone in mental distress has been around for a long time, the concept of mental health first aid as a trained medical skill came about in Australia in 2000, and has since spread around the world. Mental health first aid training allows someone to recognise the signs of a mental health crisis and potentially offer support for someone suffering from a panic attack, overwhelmed by trauma, considering suicide, or adversely affected by alcohol or drugs – or many other conditions.
Deaths From Preventable Long-term Conditions
Reducing death from preventable long-term health conditions is not an easy process and often requires both community education and a culture shift around certain societal norms. For example, the slow shift of the last few decades towards smoking being viewed as a negative habit and the acceptance of “slip, slop, slap” behaviour when in the sun has significantly impacted deaths due to lung and skin cancer.
It’s possible for other long terms conditions, such as heart disease and diabetes, to also see improvement, but they would most likely require a similar shift in cultural perceptions of things like food and alcohol.
Preventable Deaths In Medical Emergencies
Although many medical emergencies – such as stroke, cardiac arrest, or people injured in assaults – are hard to predict, many deaths from such incidents could be prevented with more widespread first aid training. According to a study by the Red Cross, Australia has one of the worst first aid training rates in the world. In 2017 only 5% of the population had formal first aid training, preparing them to respond in a medical emergency. This isn’t great compared to countries like Norway, where 90% of the population have some form of first aid training.
Unlike many countries that have first aid included in the school curriculum, in Australia first aid training is predominantly either a workplace requirement or a voluntary choice. Even in the workplace, it’s often only required for a designated first aid officer – although in professions such as teaching and childcare, it’s generally mandatory for all staff.
Stats On First Aid
With improved first aid training rates, more bystanders would be equipped to step in and assist in an emergency – treating wounds, administering CPR, or even applying a defibrillator if one is available.
First aid training can’t guarantee the survival of someone in a medical emergency. For example, the survival rate for cardiac arrest victims receiving on-site CPR is quite low – only around 10%. This can be quite a shock to people who’ve seen it work 9 times out of 10 in movies and on television shows. However, if a total of 1000 people received CPR when suffering a cardiac arrest, that’s 100 survivors that wouldn’t be alive otherwise!
To put it another way, around 22,000 – 33,000 Australians die each year of cardiac arrest. Even if only a third of those had other people present, it would mean up to 11,000 Australians each year die while someone was looking on. If 90% of those people had first aid training (as in Norway), and only 10% of those treated survived, that’s possibly up to 1000 people a year that could be saved with CPR first aid or the use of an AED. That’s more than 30 times the number killed by animals each year. It’s more deaths than bushfires have caused in the last century.
This means that for all the hype about Australia’s deadly animals or terrifying natural disasters, you’re far more likely to die from a cardiac arrest while the people nearby stand there helpless. Lack of first aid knowledge kills far more people than snakes ever did!
Basic first aid concepts can be taught even to young children. Each year in Australia, around 260 children die due to unintentional injury. A quarter of young people have needed to respond to an asthma attack. One in every three teenagers has needed to assist someone with a head injury, and one in five has needed to help someone choking. Whether they’re ready for it or not, young people are finding themselves in need of first aid skills.
As such, many people now support the idea of First Aid being a mandatory part of the school curriculum in Australia.
How Has Covid 19 Impacted Australian Population Statistics?
As of January 2023, more than 11 million cases of Covid 19 have been reported in Australia. Even with a small proportion of those being reinfections, it still remains the case that over a third of Australia’s population have now, at some point, been infected with Covid 19. The infection rates have varied from state to state (in the ACT Covid has infected around half the population), but as of November 2022 only one state (Queensland) had experienced less than a 40% infection rate.
Currently, the number of deaths due to Covid stands at more than 17,000, meaning that in Australia, around 0.15% of Covid 19 infections have been fatal. That’s more deaths than any disease or disaster in our history – if it were classed as a natural disaster, it would be easily the worst on record. Although that’s obviously not good news, it’s not too bad in global terms – given that the official global fatality rate is just over 1%, and may even be higher (there’s strong scientific evidence that some countries aren’t turning in all their paperwork when it comes to Covid 19 deaths).
There are a lot of factors that may contribute to this low Covid fatality rate, including an extensive national vaccination program and mass lockdowns slowing the spread of the disease – meaning hospital facilities could accommodate the serious cases and give them treatment.
Interestingly enough, the last Australian census took place on a night when lockdowns and border closures were in effect throughout much of Australia. This has shown some interesting things. For example, of the 12 million people currently in the Australian workforce, more than 21% worked from home on the day of the census. This probably would have been almost inconceivable ten years ago. And although this happened largely out of necessity, it does show us that currently, more than 2.5 million Australians could plausibly work from home. That’s a fact that’s already starting to alter the way we think about work in Australia.
It’s worth noting that this varied from region to region. The east coast of Australia seemed to have a lot more flexibility around working remotely, with a total of 31% of the workforce working from home. By contrast, only 4.2% of workers in the Northern Territory worked from home on census day.
The Financial Impact Of Covid 19
Census night also showed some of the financial cost of Covid 19, with 6.5% of the workforce listing themselves as having worked zero hours in the past week. That’s almost double the figure from the 2016 census (3.5%). Not everyone had the luxury of doing their job from home, and many simply didn’t have the option of working during lockdowns.
Although there have been a significant number of casualties from Covid, in many ways it’s feared that the ongoing impact of Covid on Australia may be economic. Despite the many Covid 19 deaths, 2020 actually saw a distinct drop in the overall death rate per capita (6.3 deaths per 1000 people, compared to 6.6 in 2011 and 6.7 in 2021). It’s possible that a flow-on effect of lockdowns and social distancing has been to keep us all safer overall.
However, 2020 also saw an extraordinary drop in employment figures (giving us the worst unemployment rate in twenty years) and dramatic increases in rent, house prices, and inflation. A survey in march 2020 suggested that 77% of Australians had significant concerns over the overall economic impact of Covid long term. This proved to be well founded, with the GDP falling 0.3% that month, and 870,000 people losing their jobs by the end of May.
There was also a distinct side-step in which jobs people were choosing. For example, the retail and hospitality industries lost more than 100,000 workers, while the IT industry saw a significant increase in workers.
We’re now seeing significant recovery in many of these areas, such as unemployment. But other areas still have a way to go, and it may be some time before house prices and rent begin to become more affordable.
Does Australia Have An Ageing Population?
The answer to that one is a pretty definite “yes”. In 1960, more than 30% of the Australian population were children and young teens, aged 14 and under – what’s why they called the post World War 2 period the “Baby Boom”. A little over 60% were aged 15-64, and less than 9% were over 65 – what we now regard as retirement age. These numbers have been steadily shifting over the last 80 years, and in 2021 the census showed less than 20% of Australians under 15, around 64% between 15 and 64, and more than 16% over 65. That means that since the sixties, our numbers percentage of children has dropped by a third, and our number of retirees has almost doubled.
Now, this is actually a good thing. We often hear politicians talk about “the ageing population” as a problem to be addressed. But what it really means is Australians are living longer. The life expectancy at birth (i.e. the average life span) of Australians has been steadily climbing over the years. In 1991, the figures were 74.4 years for men and 80.3 years for women (who, as mentioned before, tend to live longer than men). In 2021, the figures were 81.2 years for men and 85.3 for women – which means that in the last three decades, our lives all got 4-5 years longer on average.
What Are The Implications Of An Ageing Population In Australia?
For politicians, this can often be a big issue, as if a sixth of the population is retired, that means they’re not really paying taxes anymore and they could potentially be depending on the welfare system to pay the bills. This is probably why in the last 30 years the Australian government has instituted a mandatory superannuation system – currently ranked among the world’s best retirement systems – with a staggering $3.5 trillion invested as of March 2022.
So when you hear politicians talking about the problems of an ageing population, it’s worth remembering that the reason for the ageing population is improved conditions, better living standards, and improvements in medical science, ultimately meaning that people are living longer.
The Good News
So, having looked at some of the negative aspects of living in Australia (and seeing that some of our reputation as a questionable place to live isn’t really deserved), what are some of the positive numbers of life in Australia? How many people live in Australia? Is that number growing? How open is Australia to other cultures? Is the story different for men or women? And where do most people live in Australia?
What Is The Population Of Australia?
In June 2021, the Australian population was officially recorded by the census as having 25.4 million people. We’ve also been growing steadily over the last few decades. Based on recent figures, the ABS actually maintains an up-to-the-minute estimate of our current population – which at the time of this article was 26,258,643 people and counting.
Ooops… No. Now it’s 26,258,644.
It’ll be a fair bit more by the time you read this. That means we now have around one and a half times the population we had in 1991 (17.3 million), and we can now safely talk about our population as “around 26 million” or even “more than 26 million” without being off the mark.
That relatively steady increase in population has been due to several factors, including natural population increase (births) and immigration.
Which Regions Of Australia Have The Highest Population Density?
Not all regions within Australia are the same, of course. Throughout its history, Australia has always had its population focussed in specific locations – and this is still very true today. In the 2020s, nearly three-quarters (around 72%) of our population lives within our major cities (such as Sydney, Adelaide, and Brisbane). Another 26% live in what we call “Regional Australia”, which encompasses much of the areas around the major cities and a decent part of the south and east coast – including regional centres such as Broken Hill, Whyalla, Cairns and Bundaberg. The remaining areas of Australia – which includes most of our landmass and various regional centres like Alice Springs, Mount Isa, Katherine and Broome – are classified as “Remote and Very Remote Australia”, and are home to only 2% of the population.
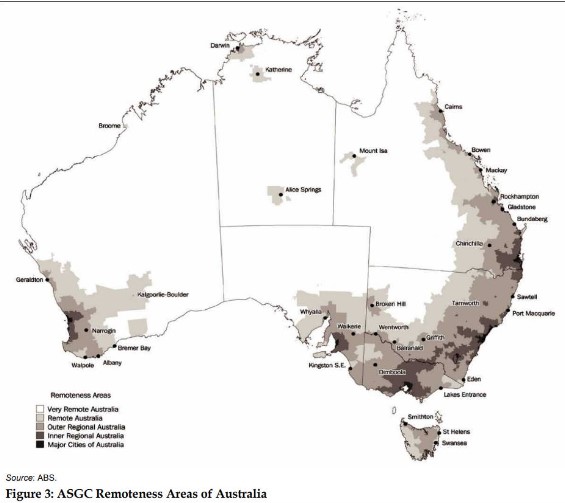
Yes, the vast majority of Australia’s landmass is dry red desert or tropical wilderness (up north) with barely a soul to be seen. This is why we’re the 6th largest country in the world in terms of size but only 56th on the list when going by number of people – most of our country isn’t very livable. In fact, we’re officially the third most sparsely populated country in the world (only beaten by Namibia and Mongolia), putting us in 242nd place on the list of densely populated countries. Which is probably why the British exploded nuclear bombs here in the fifties, and hardly anyone remembers except the locals.
How Has Australia’s Population Grown?
Over the last thirty years, Australia’s population has been increasing steadily, at an average rate of about 1.3% per year. There have been a few fluctuations – the rate sinking right down to 0.6 in 2007 and then spiking up to 2.1% in 2009, but overall it’s been relatively steady. That is, until 2021 – when it plummeted down to 0.2% overall – most likely due to Covid 19 and the restrictions around it.
There are two main factors that contribute most towards Australia’s population growth. First is the natural growth rate – which is a very formal way of saying “people having babies”.
Australia’s fertility rate has been relatively solid over the last three to four decades, generally fluctuating between about 1.7 and 2 children per woman of childbearing age. This has consistently been better than the death rate, meaning that Australia has enjoyed a steady natural population increase regardless of other factors.
Then in the last few years, the fertility rate has dropped to its lowest-ever figure – 1.58, as of 2020. The exact reason for this isn’t yet understood, and there are questions about whether this is one flow-on effect of the Covid-19 pandemic. It remains to be seen what effect this might have on the Australian population long term and how long the trend of low fertility might continue.
The second factor contributing to Australia’s population growth is something that’s been a significant (if a little chequered) part of Australian history – immigration.
How Has Immigration Contributed To Australia’s Population Growth?
For the last 15 years, migration has been the main driver of Australia’s growth for the last fifteen years, actually contributing more people to the population than childbirth. This has varied over the years, with only 30,000 immigrants entering Australia in 1992-1993, compared to a staggering 300,000 in 2008-2009 (shortly after the Global Financial Crisis, which Australia survived better than most). But on average, migration has contributed to more than half of Australia’s population growth in recent years.
Of course, this was all turned on its head by the Covid-19 pandemic. In fact, border closures and recent migrants returning home (potentially to avoid being cut off from family) meant that 2021 saw Australia’s first population loss due to migration since World War 2 – with nearly 90,000 migrants leaving our shores. The natural birth rate was higher than this figure, but it did mean Australia saw the overall population grow by less than 45,000 that year. That’s a growth rate of under 0.2% overall.
It remains to be seen how this changes over the coming years as things slowly recover from the pandemic.
Historically, Australia has depended heavily on immigration to grow our population and fuel our workforce. We’re technically a nation of immigrants, with first nations people making up less than 4% of the populace.
We haven’t always had the best track record with immigration, of course – with policies like the “White Australia policy” being enforced throughout the first part of the 20th century. This now notorious policy prevented anyone not of white European descent from immigrating to Australia by forcing them to take a language test that was designed to be impossible (the White Australia policy dictation test was deliberately given in a language the person didn’t speak). If you’ve ever wondered why the Australian population is predominantly white despite the nearest neighbouring continents being Asia and Africa, that’s why.
The White Australia policy finally began to be disbanded in the 1960s by Harold Holt’s government (yes, he did achieve some things other than mysteriously disappearing without a trace). It was officially ended in 1973 under Gough Whitlam, and soon after that, the Racial Discrimination Act of 1975 made it illegal to use race as a criterion for any official purpose.
In recent years we’ve embraced a far more diverse range of nationalities in Australia, boosting population growth and moving us closer towards being a genuinely multicultural nation. But it’s worth remembering that only a few decades ago (within living memory), our track record for racial equality was pretty poor.
Have Things Changed Much In Terms Of Immigration?
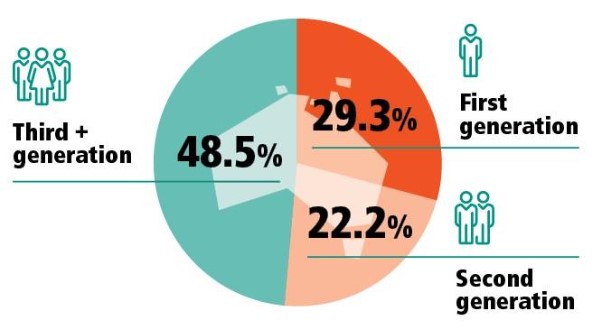
It’s fair to say yes, they have. In 1966 when the White Australia Policy was overturned, the proportion of our population that was born overseas was around 18.4%. That figure has now gone up rather dramatically to around 29.3% in 2021.
Of course, if you’re going to look at questions like “what is the population of Greeks in Australia?”, it’s not just as simple as looking at who was born overseas – you also need to consider those born in Australia to migrant parents or grandparents. Currently, 22.2% of our population are first-generation Australians (with at least one parent born overseas), which means that overall, less than half of our current population have both parents born in Australia.
Things have also improved in terms of our racial and cultural spread. Although England is still the most frequent country of birth for Australians born overseas (nearly a million), India comes in a reasonably solid second (with well over 600,000) followed by China, New Zealand, and the Phillippines. Australia’s population is slowly shifting to reflect our location on the map more than our cultural and political origins.
This is more prevalent in certain areas of Australia. For example, in the inner city regions of Sydney, nearly half the population were born overseas – hailing from 183 different countries.
This, combined with shifting trends in western culture, has also meant a shift in the religious makeup of Australia. In the 2021 census, Australia’s population was recorded for the first time ever as being predominantly non-Christian, with only 43.9% of the population identifying as Christian. However, it remains the most common religion, with Islam, Hinduism, Buddhism, Sikhism, and Judaism being the other five of the top six. The percentage of Australians reporting “no religion” continues to grow, increasing from 30.1% in 2016 to 38.9% in 2021 – which is a big jump.
This may have been affected to some extent by the “No Religion” option being moved to the top of the list on the 2021 census (a change from 2016). And yes, that sort of thing can have a provable effect on census data (some people really are lazy enough to just tick the first box they see). But the fact that the number of people answering the religion question (which is voluntary on the census) increased from 91% in 2016 to 93% in 2021 does suggest the change is not just a matter of people ticking the first box.
Have Perceptions Towards Immigration Changed?
In recent decades, Australia has begun to embrace its identity as a multicultural nation. On a government level, there are now many pathways both for skilled labour to immigrate and for overseas students to access work visas through study – both at a university level and through various trades (many of which have current skill shortages).
As diversity has become something to strive for in the west, Australian perspectives have changed to regard the multicultural aspect of our society as a strength to be celebrated and fostered. In fact, research conducted by the Scanlon Foundation in 2015 suggested that the vast majority of Australians believe that multiculturalism has been good for Australia.
This has been experienced on both sides, with most recent migrants also claiming to feel a strong sense of belonging in Australia, which deepens the longer they remain.
We also now have various government and not-for-profit organisations for the promotion of diversity and multiculturalism – including the Australian Multicultural Council (AMC), and Diversity Council Australia (DCA).
However, there is still work to be done. While skilled labour coming to Australia with the right paperwork is now welcomed, Australia has a less-than-perfect reputation internationally when it comes to welcoming refugees – to the point where the UN has recommended various changes to our refugee policy.
There are also portions of our population that aren’t totally behind the idea of multiculturalism and diversity. In recent years, the Australian Human Rights Commission reported that around one-in-ten Australians believe that some races are inferior or superior to others. 18% of Australians also report having experienced discrimination because of ethnicity, skin colour, or religion. Sadly, it may be a while before Australia’s growing cultural diversity is seen as a strength by all Australians.
Gender Numbers In Australia
Australia’s population has marginally more women than men – 50.7% female and 49.3% male. The reasons for this are varied, but women having a slightly longer lifespan on average is a factor (for reference, the 12 oldest people in the world are currently all women). There are minor variations from region to region, but the ratio is similar in most places. In terms of capital cities, Hobart and Adelaide have the lowest ratios of women to men (95.8 and 95.5 women per hundred men, respectively), while Darwin was the only capital city with more men than women – 106.8 men per hundred women. In each of these cases, the average age of the population (high amongst the people of Hobart and the Adelaide population, and low in Darwin) may contribute to this.
| City | Gender ratio (Men / 100 Women) |
| Sydney | 98.8 |
| Melbourne | 97.8 |
| Brisbane | 98.2 |
| Adelaide | 95.9 |
| Perth | 99 |
| Hobart | 95.8 |
| Darwin | 106.8 |
| Canberra | 97.5 |
| Overall (for capital cities) |
98.2 |
SOURCE: https://www.abs.gov.au/statistics/people/population/regional-population-age-and-sex/2021
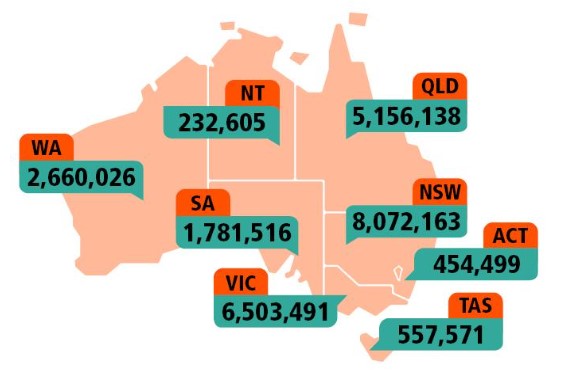
How Do State Populations Compare?
Today almost 80% of Australia’s population still lives up the eastern end of Australia, in NSW, Victoria, the ACT and Queensland. New South Wales continues to be the most heavily populated state, with more than 8 million people – a little under a third of the country. Victoria is not far behind, with 6.5 million.
Despite having the second lowest population overall (around 450,000), the ACT saw the most population growth of any state, increasing its numbers by 14.4% (around 57,000 people) since the census in 2016. The Canberra population is clearly on the rise.
SOURCE: https://www.abs.gov.au/statistics/people/people-and-communities/snapshot-australia/2021
It’s also worth looking at the specifics of each state capital (just in case you wanted to know the Perth population, or how that compares to the Hobart population, or something similar).
Australian cities by population
| CAPITAL | Population (June 2021) |
| Melbourne | 4,976,157 |
| Brisbane | 2,568,927 |
| Perth | 2,192,229 |
| Adelaide | 1,402,393 |
| Canberra | 453,558 |
| Hobart | 251,047 |
| Darwin | 148,801 |
| Total | 17,252,876 |
SOURCE: https://www.abs.gov.au/statistics/people/population/regional-population/2021
What Generation Does Australia Have The Most Of?
The most numerous generations in Australia are Baby Boomers (born 1946-1964) and Millennials (born 1918-1996), with the two generations each having 21.5% – making them exactly matched for numbers (5.4 million each at the 2021 census, with a difference of only 5,662 people). The next most numerous generations are Gen X and Gen Z – who aren’t far behind, numbers-wise.
| Generation | Born | Age in 2023 | % of Australians |
| Gen Alpha | 2013 – 2023 | 0 – 10 | 12% |
| Gen Z | 1997 – 2012 | 11 – 26 | 18.2% |
| Millennials | 1981 – 1996 | 27 – 42 | 21.5% |
| Gen X | 1965 – 1980 | 43 – 58 | 19.3% |
| Baby Boomers | 1946 – 1964 | 59 – 77 | 21.5% |
| Silent Generation (& Older) | 1945 & Older | 78 + | 7.5% |
SOURCE: https://www.abs.gov.au/statistics/people/people-and-communities/snapshot-australia/2021
Despite the media often showing Millenials and Baby Boomers butting heads, both generations are actually doing a lot to keep society running. Millennials are right in the middle of working age at this point, and represent a large element of Australia’s workforce. They’re also right at the age where people often consider a change career (possibly prompted by the Covid-19 pandemic), and 40% of Australians currently in vocational education (such as TAFE and University) are millennial. They also represent nearly half (48%) of the armed services.
Despite many Baby Boomers being of retirement age, they still do a lot to help other generations, including caring for the grandkids. Around an eighth of Baby Boomers reported regularly taking care of other people’s children. Boomers are also the generation most likely to volunteer and provide unpaid assistance to others.
Living In Australia?
For all our reputation as a nation with venomous creatures under every rock, Australia is now one of the longest-lived nations in the world. We’re steadily growing, progressively living longer and longer, and slowly becoming more and more multicultural (and more comfortable with it). We have a huge amount of space per head (even though not all of it is usable), and millennials and baby boomers vying for the position of “most numerous generation”. And although people are living well past retirement, we also have one of the world’s best retirement income systems.
Although we have some of the world’s most deadly fauna and some pretty frightening natural disasters at times, in global terms we’re actually a pretty safe place to live. And we’ve also survived both a global financial crisis and a worldwide pandemic incredibly well.
So as it turns out… living in Australia is not so bad.